12.1Analytics
The shop's sales report for a date range — Sales value, Confirmed orders, Item sales and Customers served, with a comparison against the period before.
- Menu:
- Analytics
- Who:
- Owner · Manager
- Package:
- All packages
- Updated:
- 2026-10-15
Overview
Opening the Analytics menu shows the shop's sales report. The first time you open it, the figures cover the current month — from the 1st to today, Dhaka time. Use the date boxes at the top to choose another period.
The report has four figures: Sales value, Confirmed orders, Item sales and Customers served. Under each one, a small line shows how much it changed against the previous period of the same length.
This page does not show payouts or "what you will be paid" figures from the platform at the moment. Only Owners and Managers can see it; Staff do not see this menu entry.
Screen tour
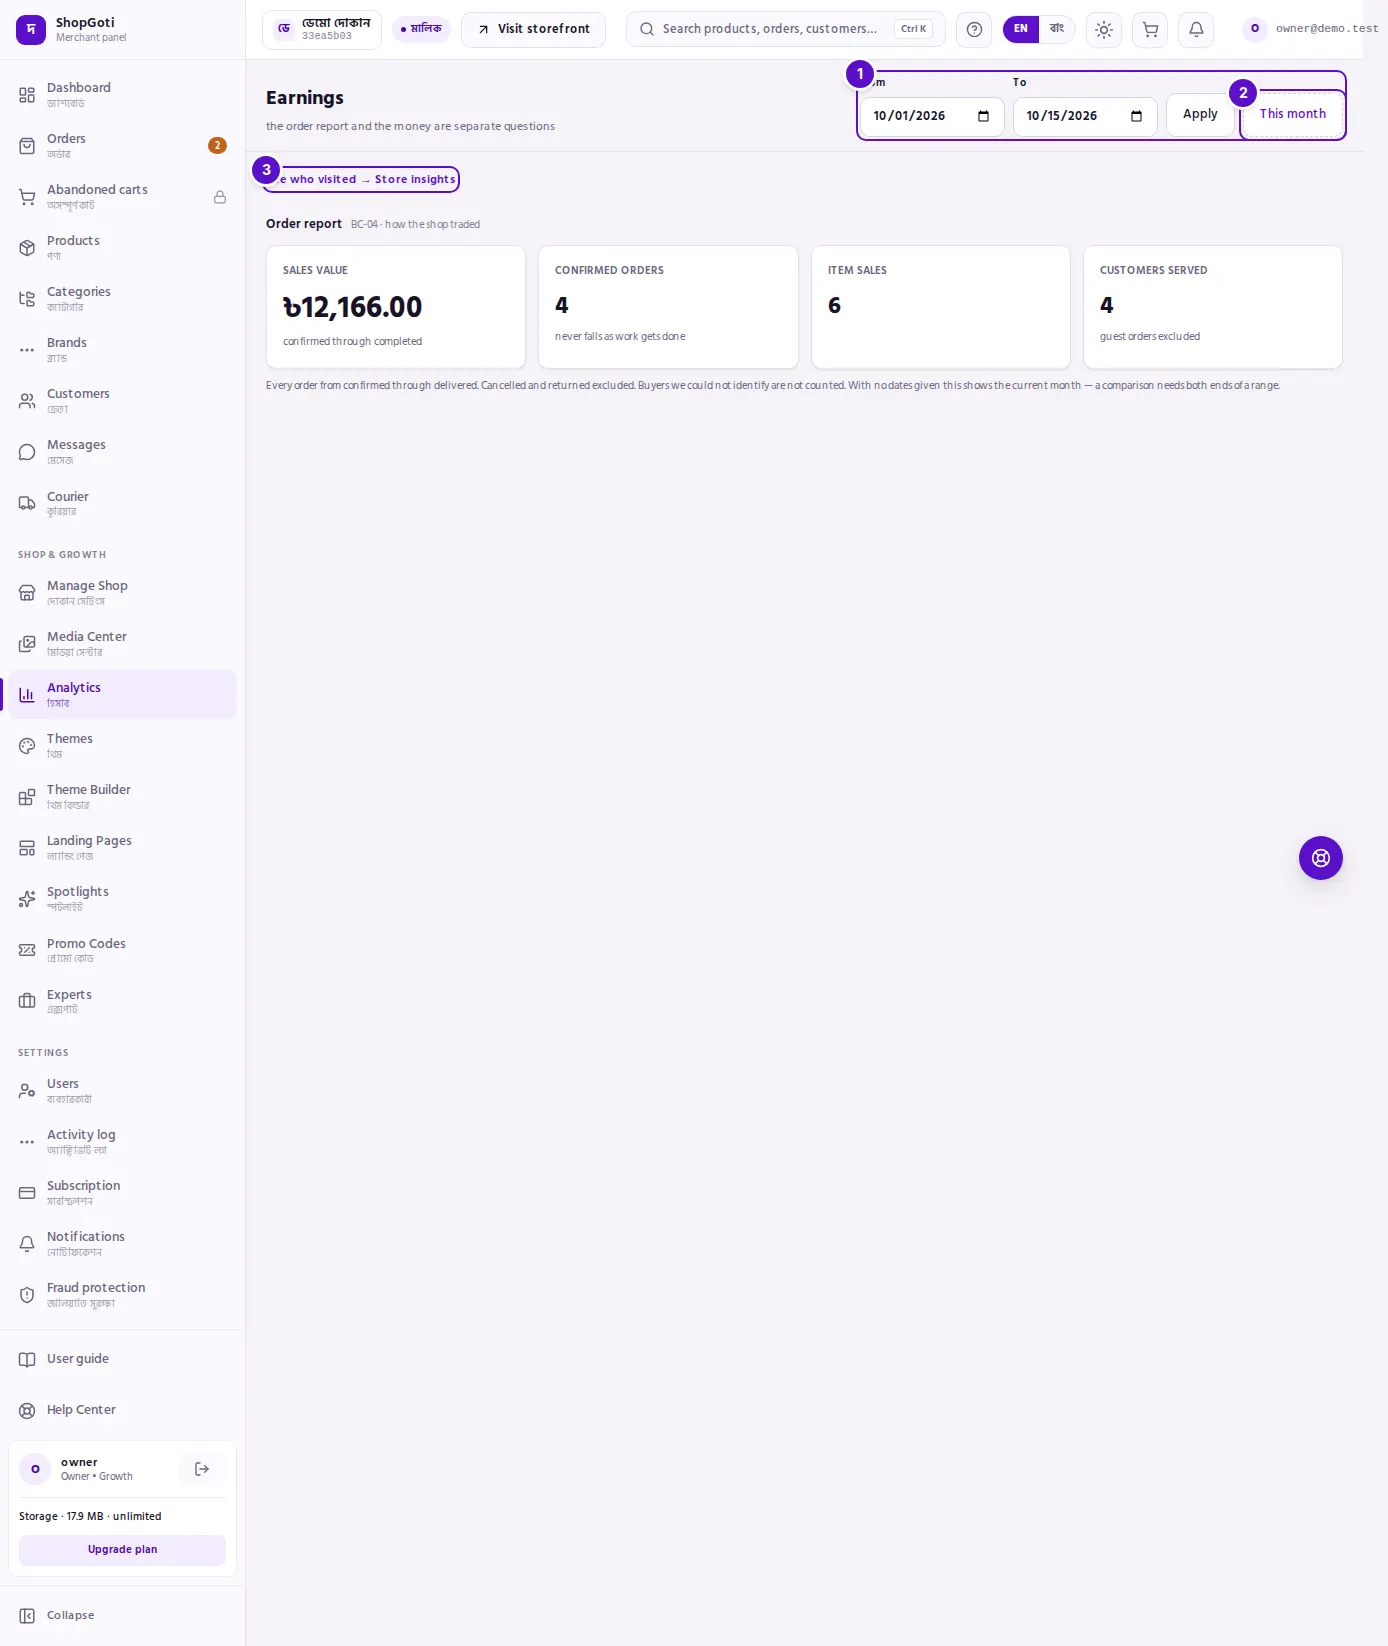
- Date boxes — From, To and the Apply button.
- This month — sets the range to the current month, from its 1st day.
- Store insights link — "See who visited → Store insights".
Under the page title the page shows a line: "the order report and the money are separate questions". The page title itself reads "Earnings" in English (আয় in Bangla).
Below that is the Order report section. Its heading has a small grey note saying where the numbers come from. It holds four tiles:
- Sales value — the total price of orders from confirmed through completed.
- Confirmed orders — how many orders were confirmed. The number does not fall as orders move on to packing, shipping or delivery.
- Item sales — the total number of products sold.
- Customers served — the number of identified buyers. Guest orders are not counted.
A note under the tiles says which orders are counted (cancelled and returned ones are left out) and which period is shown. With no dates given, the note says the current month is on screen.
Steps
Look at the sales report for another period
Steps
- Open the Analytics menu.
- In From, pick the first day of the report.
- In To, pick the last day of the report.
- Press Apply. The four figures and their comparisons change to the new period.
Compare with the period before
Steps
- Fill in both From and To.
- Press Apply.
- Look at the small line under each tile — vs the previous N days. N is the number of days in the period you chose, and the comparison is with the same number of days just before it.
Go back to the current month
Steps
- Press This month.
- The From box now holds the 1st of this month. The To box is empty.
- The tiles do not show a comparison in this state. To compare, fill in both dates and press Apply.
Open Store insights
Steps
- Press See who visited → Store insights above the report.
- Or open Store insights from the left-hand menu.
Fields
| Field | What it does |
|---|---|
| From | The first day of the report. If left empty, the 1st of the current month is used. |
| To | The last day of the report. If left empty, today is used. |
| Apply | Recalculates the report for the dates in the boxes. |
| This month | Sets the range to start on the 1st of the current month. Leaves To empty. |
Tips and common mistakes
- The heading says "Earnings". The menu says Analytics, but the page heading is still Earnings (আয়). It is the same page.
- Sales value is not cash in hand. It is the value of the orders. Cash on delivery may be counted here before the courier has handed the money over.
- Confirmed orders does not go down. Once an order is confirmed, it stays in this count as it is packed, shipped and delivered.
- Customers served leaves out guest orders. A buyer who is not identified is not counted as a customer.
- To compare, use both dates. A start date alone, or the This month button, gives no comparison line under the tiles.
- The Web revenue (confirmed) figure in Store insights is defined the same way as Sales value here.
Related pages
- Dashboard — a summary of new and on-hold orders
- Orders list — the orders behind the report, one by one
- Store insights — who is visiting and where they come from
- Profit & loss — what is left after the cost of goods and your own costs